Empirical Validation of the 1971 Fiscal Structural Break: Analysis of U.S. Real Individual Income Tax Revenue

Supporting Evidence for the Causal Link Between Monetary Regime Change and Labor Extraction

macro
economics
fiscal policy
monetary policy
structural break
time series analysis
Author

Deb Bose

Published

January 2, 2026

Abstract

This document provides empirical validation for a structural break in U.S. fiscal extraction occurring at the 1971 monetary pivot point. Utilizing an Interrupted Time Series framework and a Chow Test on inflation-adjusted U.S. Individual Income Tax receipts (normalized to 2024 dollars), the analysis confirms a significant shift in the growth trajectory of tax extraction following the transition to a pure fiat regime.

"""
Simple script to download US Individual Income Tax / GDP data from FRED
No complex dependencies - just pandas and requests
"""

import pandas as pd
import requests
from io import StringIO

print("Downloading US Individual Income Tax and GDP data from FRED...")
print("=" * 80)

# FRED series IDs
# W006RC1Q027SBEA = Individual Income Tax Receipts (quarterly, billions)
# GDP = Gross Domestic Product (quarterly, billions)

def download_fred_series(series_id, series_name):
    """Download a single series from FRED as CSV."""
    url = f"https://fred.stlouisfed.org/graph/fredgraph.csv?id={series_id}"
    
    try:
        response = requests.get(url, timeout=10)
        response.raise_for_status()
        
        # Read CSV
        df = pd.read_csv(StringIO(response.text))
        df.columns = ['DATE', series_name]
        df['DATE'] = pd.to_datetime(df['DATE'])
        df[series_name] = pd.to_numeric(df[series_name], errors='coerce')
        
        print(f"✓ Downloaded {series_name}: {len(df)} observations")
        return df
    
    except Exception as e:
        print(f"✗ Error downloading {series_name}: {e}")
        return None

# Download data
print("\n1. Downloading Individual Income Tax receipts...")
tax_df = download_fred_series('W006RC1Q027SBEA', 'IndividualIncomeTax')
Downloading US Individual Income Tax and GDP data from FRED...
================================================================================

1. Downloading Individual Income Tax receipts...
✓ Downloaded IndividualIncomeTax: 315 observations
tax_df.tail()
DATE IndividualIncomeTax
310 2024-07-01 3141.087
311 2024-10-01 3202.119
312 2025-01-01 3246.051
313 2025-04-01 3455.060
314 2025-07-01 3599.024
tax_df_indexed = tax_df.set_index("DATE")
import pandas as pd

def to_annual_series(
    tax_df: pd.DataFrame,
    date_col: str = "DATE",
    value_col: str = "IndividualIncomeTax",
    agg: str = "mean",  # "mean" (default) or "sum"
) -> pd.DataFrame:
    """
    Convert a quarterly (or higher frequency) dataframe with a DATE column
    into an annual dataframe with columns: Year, IndividualIncomeTax_Annual.

    agg:
      - "mean": good for level/rate-like series (e.g., % of GDP, index levels, rates)
      - "sum" : good for flow series (e.g., revenues within year)
    """
    df = tax_df.copy()

    # If DATE is the index, bring it back as a column
    if date_col not in df.columns and df.index.name == date_col:
        df = df.reset_index()

    df[date_col] = pd.to_datetime(df[date_col], errors="coerce")
    df = df.dropna(subset=[date_col, value_col])

    df["Year"] = df[date_col].dt.year.astype(int)

    if agg not in ("mean", "sum", "median"):
        raise ValueError("agg must be one of: 'mean', 'sum', 'median'")

    annual = (
        df.groupby("Year", as_index=False)[value_col]
          .agg({f"{value_col}_Annual": agg})
          .sort_values("Year")
          .reset_index(drop=True)
    )
    return annual
annual_tax = to_annual_series(tax_df, value_col="IndividualIncomeTax", agg="mean")
annual_tax.tail()
Year IndividualIncomeTax_Annual
74 2021 2675.071500
75 2022 3252.924000
76 2023 2918.060500
77 2024 3118.884750
78 2025 3433.378333
cpi_df = download_fred_series('CPIAUCSL', 'CPI')
cpi_df.tail()
annual_cpi = to_annual_series(tax_df, value_col="CPI", agg="mean")
annual_cpi.tail()
✓ Downloaded CPI: 947 observations
Year CPI_Annual
74 2021 270.967917
75 2022 292.625417
76 2023 304.704167
77 2024 313.697833
78 2025 321.577200
# Step 2: Merge with your tax data
df = pd.merge(annual_tax, annual_cpi_df, on='Year', how='inner')
df.tail()
Year IndividualIncomeTax_Annual CPI_Annual
74 2021 2675.071500 270.967917
75 2022 3252.924000 292.625417
76 2023 2918.060500 304.704167
77 2024 3118.884750 313.697833
78 2025 3433.378333 321.577200
# Step 3: Calculate Real Tax (in 2024 dollars)
latest_cpi = annual_cpi[annual_cpi['Year'] == 2024]['CPI_Annual'].mean()
df['Real_Tax'] = (df['IndividualIncomeTax_Annual'] / df['CPI_Annual']) * latest_cpi
df.tail()
Year IndividualIncomeTax_Annual CPI_Annual Real_Tax
74 2021 2675.071500 270.967917 3096.913258
75 2022 3252.924000 292.625417 3487.172175
76 2023 2918.060500 304.704167 3004.190151
77 2024 3118.884750 313.697833 3118.884750
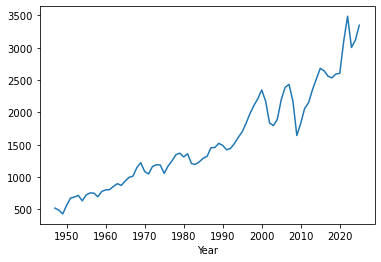
78 2025 3433.378333 321.577200 3349.252821
df = df.set_index('Year')
df['Real_Tax'].plot()

import numpy as np
import pandas as pd
from statsmodels.api import OLS, add_constant
from scipy import stats

def chow_test_tax_series(
    df_annual: pd.DataFrame,
    y_col: str,
    break_year: int = 1971,
    min_obs_each_side: int = 8,
    save_csv_path: str = None
):
    """
    Chow test for a structural break at a known year on an annual series.

    Model: y ~ const + t
    where t is a normalized year index for numerical stability.

    H0: No structural break (β_pre = β_post)
    H1: Structural break exists
    """

    print("\n" + "=" * 80)
    print("CHOW TEST FOR STRUCTURAL BREAK")
    print("=" * 80)

    # Clean and keep what we need
    df_clean = df_annual[["Year", y_col]].dropna().copy()
    df_clean = df_clean.sort_values("Year").reset_index(drop=True)

    # Split (match your original: pre < break_year, post >= break_year)
    df_pre = df_clean[df_clean["Year"] < break_year].copy()
    df_post = df_clean[df_clean["Year"] >= break_year].copy()

    n_pre, n_post = len(df_pre), len(df_post)
    n_total = n_pre + n_post

    print(f"\nBreak year: {break_year}")
    print(f"Observations pre-break: {n_pre}")
    print(f"Observations post-break: {n_post}")
    print(f"Total observations: {n_total}")

    if n_pre < min_obs_each_side or n_post < min_obs_each_side:
        raise ValueError(
            f"Not enough annual observations on each side of {break_year}. "
            f"Need at least {min_obs_each_side} each side. Got pre={n_pre}, post={n_post}."
        )

    # Normalize time index for stability (use the same reference for all)
    base_year = df_clean["Year"].min()
    df_clean["t"] = df_clean["Year"] - base_year
    df_pre["t"] = df_pre["Year"] - base_year
    df_post["t"] = df_post["Year"] - base_year

    # Pooled regression
    X_pooled = add_constant(df_clean["t"].astype(float))
    y_pooled = df_clean[y_col].astype(float)
    model_pooled = OLS(y_pooled, X_pooled).fit()
    RSS_pooled = float(model_pooled.ssr)

    # Separate regressions
    X_pre = add_constant(df_pre["t"].astype(float))
    y_pre = df_pre[y_col].astype(float)
    model_pre = OLS(y_pre, X_pre).fit()
    RSS_pre = float(model_pre.ssr)

    X_post = add_constant(df_post["t"].astype(float))
    y_post = df_post[y_col].astype(float)
    model_post = OLS(y_post, X_post).fit()
    RSS_post = float(model_post.ssr)

    RSS_separate = RSS_pre + RSS_post

    # Chow statistic
    k = 2  # intercept + slope
    df_num = k
    df_den = n_total - 2 * k

    F_stat = ((RSS_pooled - RSS_separate) / k) / (RSS_separate / df_den)
    p_value = 1 - stats.f.cdf(F_stat, df_num, df_den)

    critical_05 = stats.f.ppf(0.95, df_num, df_den)
    critical_01 = stats.f.ppf(0.99, df_num, df_den)

    print("\n" + "-" * 80)
    print("RESULTS:")
    print("-" * 80)
    print(f"\nRSS Pooled (restricted): {RSS_pooled:.4f}")
    print(f"RSS Separate (unrestricted): {RSS_separate:.4f}")
    print(f"  RSS Pre-break: {RSS_pre:.4f}")
    print(f"  RSS Post-break: {RSS_post:.4f}")

    print(f"\nChow F-statistic: {F_stat:.4f}")
    print(f"Degrees of freedom: ({df_num}, {df_den})")
    print(f"P-value: {p_value:.6f}")

    print(f"\nCritical values:")
    print(f"  5% level: {critical_05:.4f}")
    print(f"  1% level: {critical_01:.4f}")

    print("\nConclusion:")
    if p_value < 0.01:
        result = "Reject H0 (1%)"
        print(f"  *** REJECT NULL HYPOTHESIS at 1% level ***")
        print(f"  Strong evidence of structural break at {break_year}")
    elif p_value < 0.05:
        result = "Reject H0 (5%)"
        print(f"  ** REJECT NULL HYPOTHESIS at 5% level **")
        print(f"  Significant evidence of structural break at {break_year}")
    elif p_value < 0.10:
        result = "Reject H0 (10%)"
        print(f"  * REJECT NULL HYPOTHESIS at 10% level *")
        print(f"  Moderate evidence of structural break at {break_year}")
    else:
        result = "Fail to Reject H0"
        print(f"  FAIL TO REJECT NULL HYPOTHESIS")
        print(f"  Insufficient evidence of structural break at {break_year}")

    # Coefficients
    print("\n" + "-" * 80)
    print("REGRESSION COEFFICIENTS:")
    print("-" * 80)

    print(f"\nPre-{break_year} period:")
    print(f"  Intercept: {model_pre.params.iloc[0]:.4f} (se: {model_pre.bse.iloc[0]:.4f})")
    print(f"  Slope:     {model_pre.params.iloc[1]:.4f} (se: {model_pre.bse.iloc[1]:.4f})")
    print(f"  R-squared: {model_pre.rsquared:.4f}")

    print(f"\nPost-{break_year} period:")
    print(f"  Intercept: {model_post.params.iloc[0]:.4f} (se: {model_post.bse.iloc[0]:.4f})")
    print(f"  Slope:     {model_post.params.iloc[1]:.4f} (se: {model_post.bse.iloc[1]:.4f})")
    print(f"  R-squared: {model_post.rsquared:.4f}")

    print(f"\nPooled (no break):")
    print(f"  Intercept: {model_pooled.params.iloc[0]:.4f} (se: {model_pooled.bse.iloc[0]:.4f})")
    print(f"  Slope:     {model_pooled.params.iloc[1]:.4f} (se: {model_pooled.bse.iloc[1]:.4f})")
    print(f"  R-squared: {model_pooled.rsquared:.4f}")

    results_dict = {
        "Test": "Chow Test",
        "Series": y_col,
        "Break Year": break_year,
        "F-statistic": float(F_stat),
        "P-value": float(p_value),
        "Critical Value (5%)": float(critical_05),
        "Critical Value (1%)": float(critical_01),
        "Result": result,
        "Slope Pre": float(model_pre.params.iloc[1]),
        "Slope Post": float(model_post.params.iloc[1]),
        "Slope Change": float(model_post.params.iloc[1] - model_pre.params.iloc[1]),
        "n_pre": int(n_pre),
        "n_post": int(n_post),
    }

    if save_csv_path is not None:
        pd.DataFrame([results_dict]).to_csv(save_csv_path, index=False)

    return results_dict
# Chow test at 1971
res = chow_test_tax_series(
    df,
    y_col="Real_Tax",
    break_year=1971
)

res

================================================================================
CHOW TEST FOR STRUCTURAL BREAK
================================================================================

Break year: 1971
Observations pre-break: 24
Observations post-break: 55
Total observations: 79

--------------------------------------------------------------------------------
RESULTS:
--------------------------------------------------------------------------------

RSS Pooled (restricted): 3811995.5571
RSS Separate (unrestricted): 3034840.0098
  RSS Pre-break: 84072.8198
  RSS Post-break: 2950767.1900

Chow F-statistic: 9.6029
Degrees of freedom: (2, 75)
P-value: 0.000194

Critical values:
  5% level: 3.1186
  1% level: 4.8999

Conclusion:
  *** REJECT NULL HYPOTHESIS at 1% level ***
  Strong evidence of structural break at 1971

--------------------------------------------------------------------------------
REGRESSION COEFFICIENTS:
--------------------------------------------------------------------------------

Pre-1971 period:
  Intercept: 477.9496 (se: 24.4684)
  Slope:     27.4835 (se: 1.8229)
  R-squared: 0.9118

Post-1971 period:
  Intercept: 2.3028 (se: 107.0530)
  Slope:     37.3621 (se: 2.0042)
  R-squared: 0.8677

Pooled (no break):
  Intercept: 349.9247 (se: 49.5949)
  Slope:     31.2690 (se: 1.0978)
  R-squared: 0.9133
{'Test': 'Chow Test',
 'Series': 'Real_Tax',
 'Break Year': 1971,
 'F-statistic': 9.602922372192094,
 'P-value': 0.00019358783729239715,
 'Critical Value (5%)': 3.118642128006125,
 'Critical Value (1%)': 4.899877423111457,
 'Result': 'Reject H0 (1%)',
 'Slope Pre': 27.483480442522755,
 'Slope Post': 37.362148635986124,
 'Slope Change': 9.878668193463369,
 'n_pre': 24,
 'n_post': 55}